
Powder Coating Line Capacity — How Many Parts Per Hour?
The hourly capacity of a powder coating line is not picked from a catalogue; it is calculated from conveyor speed, hanger spacing and parts per hanger. The formula, worked examples for three part sizes, the ceiling the oven length imposes, and where the bottleneck actually appears.
 Enlarge
The hourly capacity of a powder coating line is not a figure selected from a catalogue; it is calculated from three inputs: conveyor speed, hanger spacing, and the number of parts hung per hanger. The formula is:
Parts per hour = (conveyor speed × 60) ÷ hanger spacing × parts per hanger
We build conveyors to run between 1 and 6 m/min. At 3 m/min, with 0.5 m hanger spacing and 4 parts per hanger, the line carries 360 hangers an hour and delivers 1,440 parts/hour. Put a larger part on the same line so that only one fits per hanger, and at the same speed capacity falls to 360 parts/hour. The line did not change — the part did.
This is why the only honest answer to "how many parts per hour does your line do?" is "tell us your part."
The capacity formula and the speed–spacing table
The first half of the formula is the line's transport capacity, and it is independent of the part: how many hangers pass per hour?
| Conveyor speed | Hanger spacing | Hangers/hour | 1 part/hanger | 4 parts/hanger | 12 parts/hanger |
|---|---|---|---|---|---|
| 1 m/min | 0.4 m | 150 | 150 | 600 | 1,800 |
| 2 m/min | 0.4 m | 300 | 300 | 1,200 | 3,600 |
| 2 m/min | 0.3 m | 400 | 400 | 1,600 | 4,800 |
| 3 m/min | 0.5 m | 360 | 360 | 1,440 | 4,320 |
| 4 m/min | 0.5 m | 480 | 480 | 1,920 | 5,760 |
| 4 m/min | 0.8 m | 300 | 300 | 1,200 | 3,600 |
| 5 m/min | 0.6 m | 500 | 500 | 2,000 | 6,000 |
| 6 m/min | 0.6 m | 600 | 600 | 2,400 | 7,200 |
The first lesson in that table: shortening the hanger spacing does the same job as raising the speed — and does it without lengthening the oven. Going from 0.5 m to 0.3 m raises capacity by 66%. The limit is that every part must still see enough electrostatic field without being shadowed by its neighbour; crowd the hangers and coating uniformity in the booth breaks down.
Worked examples for three part sizes
The same line gives three different numbers on three different jobs. All three are real installation scenarios:
| Scenario | Part | Hanger spacing | Parts/hanger | Speed | Hangers/hour | Capacity |
|---|---|---|---|---|---|---|
| Small part | Hinge, bracket, fitting (150 mm) | 0.3 m | 12 | 2 m/min | 400 | 4,800 parts/hour |
| Medium part | Sheet panel, shelf, housing (600 mm) | 0.5 m | 4 | 3 m/min | 360 | 1,440 parts/hour |
| Large part | Door leaf, chassis (1,500 mm) | 0.8 m | 2 | 4 m/min | 300 | 600 parts/hour |
Note what that table says: the scenario producing the highest capacity runs the slowest conveyor. On a small-part line, capacity comes from hanger density, not speed. On a large-part line, you can open the speed all the way and the hanger spacing still pulls you down.
Those three rows also explain the most common mistake in line selection: the buyer sees "5,000 parts/hour," buys a line for a medium-sized part, and ends up at 1,400. The claim was not wrong — the part is different.
Where does the 500–5,000 parts/hour range for tunnel lines come from?
Both ends of the 500–5,000 parts/hour range we quote for our tunnel lines are in the table above. The low end is the large-part scenario: wide hanger spacing, one or two parts per hanger. The high end is the small-part scenario: tight spacing, ten to twelve parts per hanger. Same mechanical line, same conveyor, same oven.
So the range describes the part spectrum, not the strength of the line. Where your own number lands inside it is set by your part size and your hanger layout. How the line lays out and how much floor it needs is a separate question: plant area and layout.
How does oven time cap the capacity?
So far we have calculated the line's transport capacity. Now comes the part that sets the ceiling. Powder does not cure by temperature but by temperature × time. The part has to stay in the oven as long as it needs to, while the conveyor keeps flowing. The result is a simple product:
Oven hot-zone length = cure time × conveyor speed
| Conveyor speed | 10 min cure | 15 min cure | 20 min cure |
|---|---|---|---|
| 1 m/min | 10 m | 15 m | 20 m |
| 2 m/min | 20 m | 30 m | 40 m |
| 3 m/min | 30 m | 45 m | 60 m |
| 4 m/min | 40 m | 60 m | 80 m |
| 6 m/min | 60 m | 90 m | 120 m |
This table holds the most expensive fact in the whole calculation: doubling the speed means doubling the oven. And the oven is the longest, the most heavily insulated and the most energy-hungry section of the line. That is why we grow capacity through hanger density before speed; tightening the spacing does not lengthen the oven.
Cure time comes from the powder's own technical data sheet and stretches with part wall thickness. A thick casting takes longer to reach metal temperature than thin sheet, and the time on the data sheet is not "time in the oven" but "time after the part reaches temperature." On lines running heavy parts, the heat-up allowance has to be added to the oven length as well.
Does it make sense to keep the oven short and run slower?
Usually yes. On a limited budget, a 30 m oven with a 3 m/min conveyor is far cheaper to build than a 60 m oven with a 6 m/min conveyor, and you recover the capacity through hanger density. The drawback: if your part grows later, you have to open the hanger spacing and capacity drops directly. This is why we recommend sizing the oven not for today's part, but for your largest part three years out.
Where does the bottleneck appear: pretreatment, oven or booth?
A line's capacity is the capacity of its slowest station. There are four candidates, and each shows a different symptom:
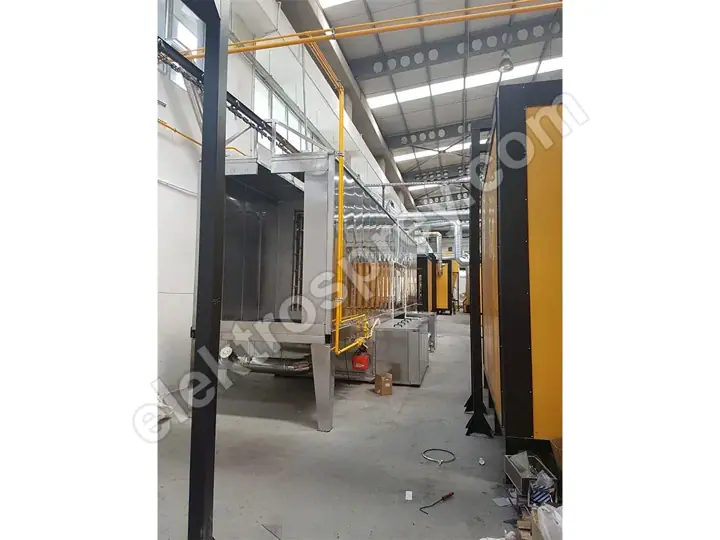
| Station | What limits it | Symptom when speed is raised |
|---|---|---|
| Pretreatment | Chemical contact time; number of stages (3–7) and tank length | Oil residue, adhesion loss, early corrosion |
| Powder booth | Number of guns (2–12), internal air velocity 0.5–0.8 m/s | Thin film, uncoated zones, recovery rate falling |
| Oven | Cure time × speed = length | Under-cure; failure on the nail or solvent rub test |
| Load / unload | Operator count and time to hang a part | Empty hangers; the line slowing itself down |
In practice the bottleneck order is usually: pretreatment first, then the oven, the booth last. The insidious part about a pretreatment bottleneck is that the result does not show the same day; the paint holds, the part ships, and the problem surfaces in the field three months later. How many stages you need depends on the substrate and the expected outdoor life: how many pretreatment stages.
The booth is rarely the real bottleneck, because gun count is the one item that can be increased afterwards. The oven cannot be lengthened afterwards — which means the capacity decision is in practice the oven decision.
Can I increase capacity after the line is installed?
Partly. What can be raised: gun count, hanger density, a second shift, loading staff. The one thing that cannot is the oven's hot-zone length; enlarging it means rebuilding the oven. We set out the full installation sequence step by step in the powder coating plant setup guide.
Why is the calculation different on an aluminium profile line?
With aluminium profile, capacity is not measured in parts/hour, because there is no such thing as a part — there are profiles 3 to 7 m long. The unit is metres/hour or m²/hour, and the calculation changes at two points.
First, the hanging layout. Profile is hung vertically, so line height sets the capacity; how many profiles hang side by side per hanger depends on the profile section and on whether the electrostatic field can reach between them. At the same conveyor speed, a thin section multiplies parts per hanger several times over.
Second, colour change. Profile work is by nature small-batch and multi-colour. On our aluminium U-type lines we complete a colour change in under 20 minutes; that figure is set by booth geometry and by how fast the recovery system can be cleaned down.
This second item enters the capacity calculation directly. If you make six colour changes in an eight-hour shift, a 20-minute changeover costs you 2 hours — effective running time drops to 75%. The same work with a 45-minute changeover would cost 4.5 hours, half the shift. On a profile line, what usually determines capacity is not conveyor speed but colour change time.
What information is needed to calculate capacity?
Four data points are enough for a quotation:
- The three dimensions and the weight of your largest part (these set hanger spacing and conveyor load),
- Your daily or monthly target quantity, together with how many shifts you will run,
- The substrate — sheet, casting, aluminium, galvanised (this sets the pretreatment stage count),
- Colour variety and batch size (this sets the colour-change loss).
From those four we work backwards to conveyor speed, hanger spacing, oven length and booth gun count, and manufacture the tunnel type line accordingly.
Summary
Capacity is not a product feature, it is the result of a calculation. Conveyor speed and hanger spacing give the transport capacity; oven length caps it; the slowest of the pretreatment, booth and loading stations sets the number you actually get. The 500–5,000 parts/hour range is simply the two ends of that calculation.
Send us the dimensions of your largest part and your daily target quantity — we will calculate the line speed, the hanger layout and the oven length, and quote it.